French Broad Riverkeeper Releases New Report on River’s Health
Asheville, NC – The French Broad Riverkeeper has released the State of the French Broad River Watershed 2018, the first published report that grades the cleanliness and water quality of 62 creeks and streams throughout the French Broad Watershed.
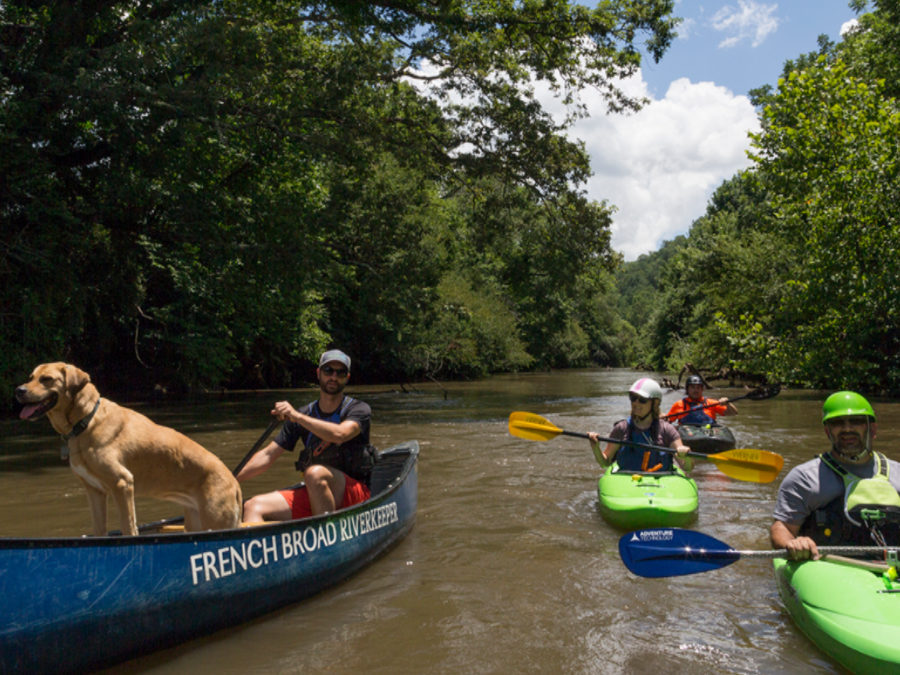
“Right before jumping into the river, the number one question people ask me is ‘Is it clean?’” says French Broad Riverkeeper Hartwell Carson. “This report is an answer to that question.”
 The report combines testing results from the North Carolina Department of Environmental Quality, the Volunteer Water Information Network, the Stream Monitoring Information Exchange, and MountainTrue’s volunteer water quality monitoring programs, weights the data and gives each stream a grade from A through F.
An A grade is given to streams that have excellent water quality and low pollution levels, and Fs are given to streams that have poor water quality. Sixty-six percent of streams scored A or B, a vast improvement from decades past. However improvements are still needed, as 34 percent of the rivers in the report were rated a C or a D.
Four Cleanest Streams:
Middle Fork French Broad River – 100 points
Cathey’s Creek – 100 points
Cataloochee Creek – 100 points
Pigeon, upstream of Canton – 100 points
Four Dirtiest Streams:
Turkey Creek – 60 points
Newfound Creek – 62.5 points
Boylston Creek – 65 points
Fines Creek – 65 points
The report is averaging data sets from various sources collected over the last few years. “The report serves as a good, useful guideline,” explains Hartwell Carson. “But it’s important to remember water quality will vary a bit depending on weather conditions. Water is usually dirtier right after a big rainstorm, so be more cautious when the water is cloudy.”
The cleanest waterways are well protected from pollution, and most of their watersheds are located in protected public lands that lack a lot of agriculture, development or industrial pollution sources. The dirtiest streams lack land-use protections and are heavily impacted by bad agricultural practices and development.
Sediment and bacteria pollution are the most common sources of pollution to our waters. Sediment pollution is caused by runoff from construction sites and agricultural operations as well as eroding stream banks. Bacteria pollution comes from agricultural runoff, sewage leaks and faulty wastewater treatment plants.
If you’re interested in helping to make the French Broad River cleaner and healthier, you can take part in the French Broad Riverkeeper’s water quality volunteer programs. The French Broad Riverkeeper also spearheaded the development of the Muddy Water Watch smartphone app, which allows the public to easily document and report erosion incidents to the appropriate authorities on-the-go. To learn more and download the app, visit: http://www.muddywaterwatch.com/ or get it from the Apple App Store (https://itunes.apple.com/us/app/muddy-waters-watch/id1092256794) or Google Play (https://play.google.com/store/apps/details?id=com.statcrew.muddywaterwatch).
Methodology
The State of the French Broad River Watershed, 2018 report report is an average of all the data available in the French Broad Watershed over the last several years. The report combines chemical data from the Environmental Quality Institute (EQI), benthic macroinvertebrate data from EQI and MountainTrue, E. coli data from MountainTrue’s Swim Guide, and a variety of data sources from the North Carolina Department of Environmental Quality (NCDEQ). The chemical and benthic data was converted into a number so it could be averaged into an overall rating for each stream.
Chemical data from EQI is made available through their Volunteer Water Information Network (VWIN) program. That data is rated as excellent, good, average, below average and poor. Those were assigned the following rating: excellent – 100, good – 90, average – 80, below average – 70, and poor – 60. Benthic macroinvertebrate data is provided through the Stream Monitoring Information Exchange, which lists its stream ratings as excellent, good, good-fair, fair and poor. Those rating were assigned the same ratings as the VWIN data with excellent – 100, good – 90, good-fair – 80, fair – 70 and poor – 60. Swim Guide data was assigned an average of the number of times the data passed the US Environmental Protection Agency’s safe swimming benchmark of 235 E. coli units per 100/ml. If the site passed 75% of the time, then a rating of 75 was assigned that location.
The NCDEQ data was taken from the 303(d) list of water quality data taken by the state. This data is more complicated to average than the previous data sets because it is a mix of testing results for chemical, benthic, bacteria, fish, chemical and specific pollutants . Some locations had multiple parameters measured, such as fish, bacteria and benthic. Each combination of data was assigned an average listed below.
If two parameters either meet the state standard or are good, the score is 100
State data for benthos is good/fair – 85
State data benthos is not impaired – 80
Benthos fair – 65
Benthos poor – 55
Benthos fair and fish poor – 55
Benthos poor, fish fair – 55
Fish good, benthos fair – 77.5
Benthos good/fair, fish good – 90
Fish community excellent, benthos good or vice/versa – 95
Fecal impaired – 60
Meets criteria for a long list of water quality standards – 100
Meets criteria for a long list of water quality standards with some inconclusive – 100
Meets criteria for a long list of water quality standards except one – 90
Two standards are good and one failed – 80
Data points were grouped into subwatersheds and averaged, and this is how we arrived at the final ratings as displayed in the State of the French Broad River Watershed, 2018 report.